Basic Tutorial
Example output of Exhibits
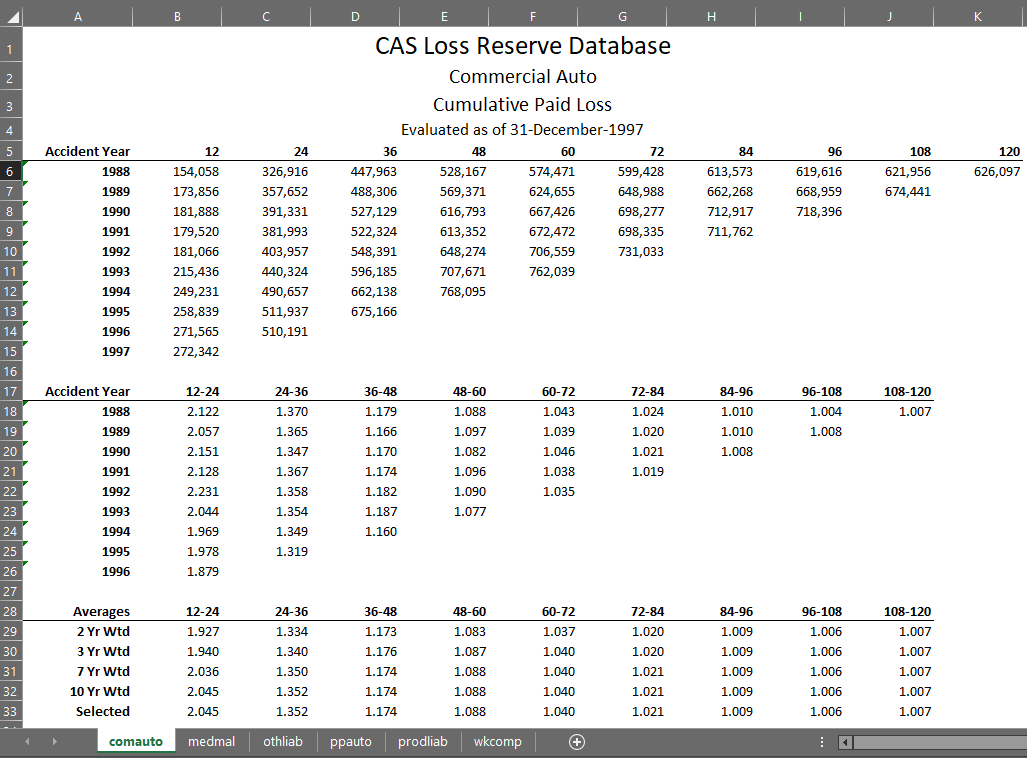
The following example highlights the general look of the outputs when using xlcompose to output to Excel.
DataFrame
xlcompose comes with a DataFrame class that has a supercharged version of
pd.DataFrame.to_excel. This version allows for the export of any number of
DataFrames in any layout desired with formats of your choosing. Simply wrap a
pandas dataframe the xlcompose Dataframe to get access to this supercharged version.
- Example:
>>> import pandas as pd
>>> import xlcompose as xlc
>>> df = pd.DataFrame([['Apple', 7, 3.00],['Orange', 12, 2.50],['Banana', 13, 2.00]],
>>>                   columns=['Fruit', 'Quantity', 'Cost'])
>>> xlc.DataFrame(df).to_excel('workbook.xlsx')
Immediately, we get better default formatting and better column fitting. The
DataFrame class is used exclusively for exporting to Excel and the normal
pd.DataFrame should be used for any other purpose.
There are commonalities between xlc.DataFrame.to_excel() and
pd.DataFrame.to_excel(). For example, both have arguments for header,
index, index_label that behave identically, however the argument
placement happens at object initialization for the DataFrame:
- Example:
>>> # xlcompose
>>> xlc.DataFrame(df, header=True, index=False).to_excel('workbook.xlsx')
>>> # vs
>>> # pandas
>>> df.to_excel('workbook.xlsx', header=False, index=True, index_label='Origin')
Placing the arguments at object initialization allows for the construction of composite objects as we will see later in the Layouts section.
Formatting
Formatting output is key to having a polished looking spreadsheet, but unfortunately pandas does not provide much customization in its output. xlcompose, uses xlsxwriter to apply formats to the data cells in a DataFrame. Formats are expressed as dictionaries. You can specify a single set of formats for the entire DataFrame:
- Example:
>>> formats={'num_format': '#,#', 'font_color': 'red'}
>>> xlc.DataFrame(df, formats=formats).to_excel('workbook.xlsx')
Alternatively, you can specify formats for column individually using a nested dictionary.
- Example:
>>> formats={'Quantity':{'num_format':'#,#', 'font_color':'red'},
...          'Cost':  {'num_format':'#,0.00', 'bold':True}}
Formatting options exist for the index and header. Simply pass the desired formats through using index_formats and header_formats.
- Example:
>>> index_formats={'italic':True, 'font_color':'red'}
>>> xlc.DataFrame(df, index_formats=index_formats).to_excel('workbook.xlsx')
Note
xlcompose has default formats out of the box. As you apply your own formats, the defaults will be applied first followed by your own.
For more information on available cell formats refer to https://xlsxwriter.readthedocs.io/format.html
Series
A Series is a single column of data. While the DataFrame assigns each of its columns to a column in a spreadsheet, you can have the Series column of data span multiple columns in a spreadsheet by passing a width argument. Additionally, there is a column_width argument which determines the column width of each spreadsheet column used by the Series.
- Example:
>>> s = pd.Series(['This Series', 'Spans Multiple', 'Columns'])
>>> xlc.Series(s, width=5, column_widths=12).to_excel('workbook.xlsx')
Taken further, a Series of length 1 can be used to merge any cells horizontally.
- Example:
>>> xlc.Series(' ', width=10, column_widths=10).to_excel('workbook.xlsx')
Title
Title is a convenience class that behaves like a Series. It has its own default formatting style that looks title-esque. When passed to other objects as the title argument, its width will take on the width of the containing object. However, it can be used as a stand-alone object much like the Series.
- Example:
>>> title=['Sample Inventory',
...        'ACME Grocery Company']
>>> xlc.DataFrame(df, title=xlc.Title(title)).to_excel('workbook.xlsx')
As with everything else, formats are adjustable through the formats argument.
- Example:
>>> title_formats = [{'font_color': 'red'},
...                  {'font_color': 'green'}]
>>> xlc.DataFrame(df, title=xlc.Title(title, formats=title_formats)).to_excel('workbook.xlsx')
Image
Embedding images in Excel can be done with the Image class. Matplotlib axes
are supported as well. Because Images are not directly embedded in cells, but rather
sit on top of them, you’ll have to manage/reserve space for them. This can be done using
the width and height arguments, which reserve the corresponding cells in Excel.
- Example:
>>> import xlcompose as xlc
>>> import pandas as pd
>>> import matplotlib.pyplot as plt
>>> plt.style.use('ggplot')
>>>
>>> out = pd.Series([1,2,2.5,2,1]).plot(grid=True)
>>> xlc.Image(out, width=10).to_excel('out.xlsx')
All objects have a width and height property. These properties are used by xlcompose to manage placement in the spreadsheet using layout objects.
Image also takes a format argument, and as expected, it takes the form of a dictionary. Formatting an image follows the options provided by xlsxwriter. Available parameters and default values are:
>>>  {
...      'x_offset':        0,
...      'y_offset':        0,
...      'x_scale':         1,
...      'y_scale':         1,
...      'object_position': 2,
...      'image_data':      None,
...      'url':             None,
...      'tip':             None,
...  }
Layouts
While the addition of formats, titles and column numbering provide a little more
flexibility that can be obtained from pd.DataFrame.to_excel, xlcompose
provides a lot more flexibility with its layout objects. Layouts provide the
composability that
There are three layout objects Tabs, Row, and Column.
Note
The layout API is inspired by the bokeh/holoviz API and should be familiar to the practitioner who uses those for visualization.
Rows and Columns
Column takes multiple objects and displays them vertically. You can
embed as many objects in a column as you like.
- Example:
>>> col = xlc.Column(
...     xlc.DataFrame(df),
...     xlc.DataFrame(df, formats={'italic': True})
... )
>>> col.to_excel('workbook.xlsx')
Row takes multiple objects and displays them horizontally. Similar to
Column, you can embed as many other objects in a Row as you’d like.
- Example:
>>> xlc.Row(
...     xlc.DataFrame(df),
...     xlc.DataFrame(df, formats={'italic': True})
... ).to_excel('workbook.xlsx')
You can also nest other Row and Column objects within rows and columns. Nesting can be a deep as you want allowing for a highly customized layout.
- Example:
>>> xlc.Row(col, col).to_excel('workbook.xlsx')
Row and Column optionally take title keywords that function the same
as those in DataFrame.
- Example:
>>> composite = xlc.Row(
...     xlc.Title(['This title spans both Column Objects'],
...                formats=[{'underline': True}]),
...     col, col
... )
>>> composite.to_excel('workbook.xlsx')
CSpacer and RSpacer
Often spacing between separate components in our layout is desired. For columns you can insert a CSpacer object and for rows you can insert an RSpacer object. Like the Series the spacer objects have optional width and column_widths arguments for further customization.
- Example:
>>> composite = xlc.Row(
...     xlc.Title(['This title spans both Column Objects'],
...                     formats=[{'underline': True}]),
...     col, xlc.RSpacer(width=2, column_widths=1.1), col,
... )
>>> composite.to_excel('workbook.xlsx')
Similarly, we can use CSpacer on a Column.
- Example:
>>> composite = xlc.Column(
...     xlc.Title(['This title spans both Column Objects'],
...                     formats=[{'underline': True}]),
...     xlc.CSpacer(),
...     col,
...     xlc.CSpacer(height=2),
...     col,
... )
>>> composite.to_excel('workbook.xlsx')
Tabs
Tabs are the sheet representation of the above objects. Tabs are
different from Row and Column in that each object passed to Tabs
must be expressed as a 2-tuple corresponding to ('sheet_name', object).
The object itself can be any of the above objects.
- Example:
>>> xlc.Tabs(
...    ('a_sheet', composite),
...    ('another_sheet', composite)
... ).to_excel('workbook.xlsx')
Modifying defaults for all objects
You may choose to override all defaults. For example, by default, the font is set to ‘Calibri’. to_excel() takes an additional parameter default_formats to will apply to all nested objects you intend to export.
- Example:
>>> xlc.Tabs(
...    ('a_sheet', composite),
...    ('another_sheet', composite)
... ).to_excel('workbook.xlsx', default_formats={'font_name': 'Arial'})
If any nested object has a default override, the override will be honored over this default.